

The Problem
Rustomjee’s construction sites faced repeated shutdowns due to noise and dust complaints from surrounding communities. Authorities enforced work stoppages based on environmental threshold breaches, causing project delays, financial losses, and schedule inefficiencies. Real-time air quality and noise monitoring — with actionable intelligence — was required to maintain compliance and prevent operational disruptions.
The Solution
The AI Data Preprocessor was deployed to structure environmental sensor data from construction sites into a deterministic, AI-ready pipeline. The AnySource Data Combiner ingested field device data across monitoring zones, while the Data Context Builder enriched it with weather conditions, seasonality patterns, and computed compliance indices. This preprocessed output fed directly into NextqoreAI Analytics — enabling real-time compliance monitoring and predictive alerting across all active sites.

AnySource Data Combiner
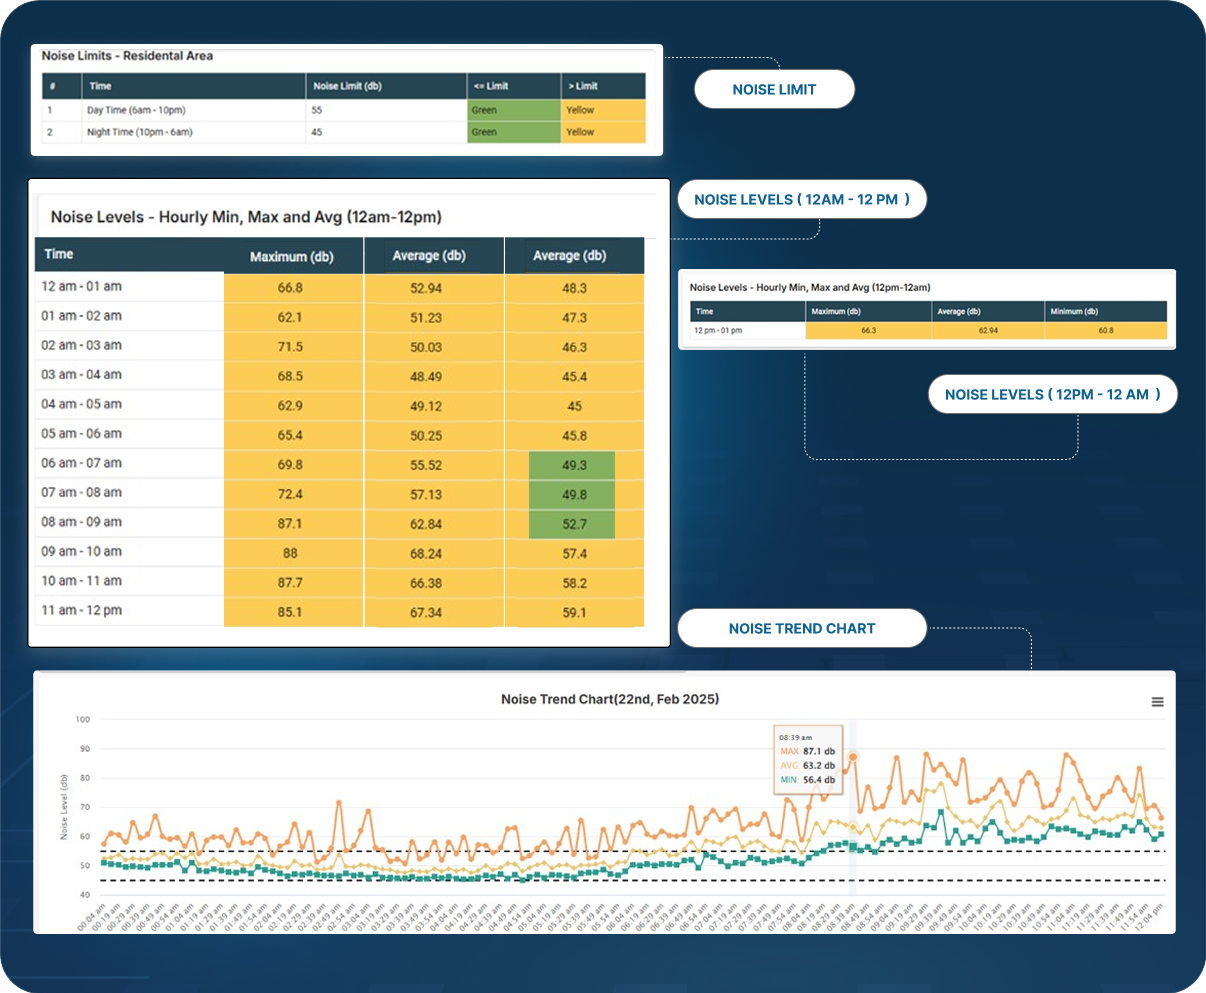
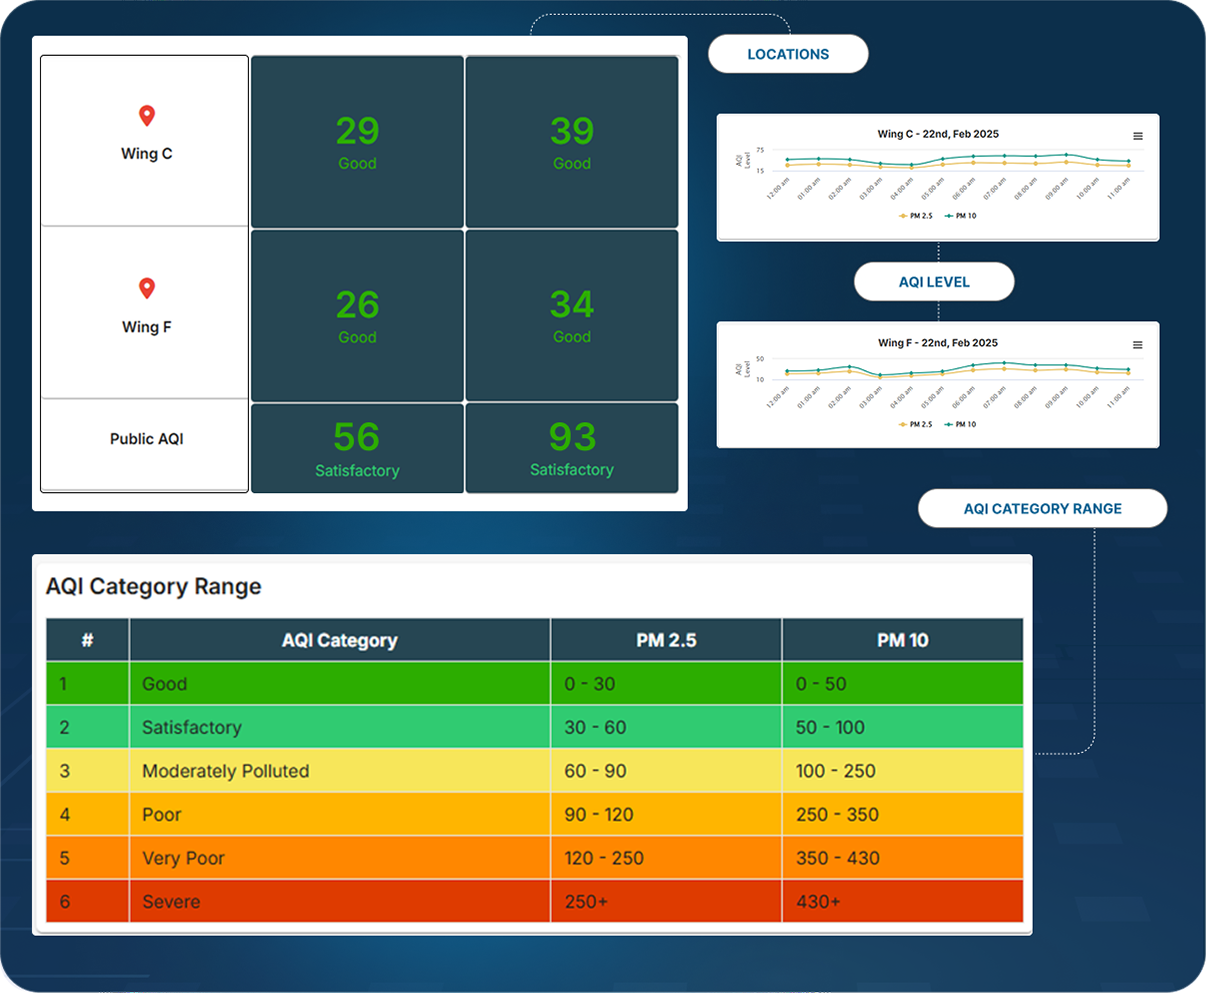
Environmental sensors measuring PM2.5, PM10, noise decibels and wind direction were connected as field device sources.
Data was ingested continuously via MQTT protocols, validated against defined quality thresholds and structured into a
unified, auditable pipeline — eliminating data gaps that previously prevented real-time compliance tracking.

Data Context Builder
The combined sensor dataset was enriched with:
- Weather context — wind speed and direction correlated to dust dispersion patterns
- Seasonality context — construction activity cycles mapped to seasonal pollution risk periods
- Computation — derived noise and air quality indices calculated across monitoring zones
- OBS — Ontology Based Semantics establishing relationships between site activity, environmental readings and regulatory thresholds
Analytics Produced By Nextqore Platform
The Result
- Real-time compliance — Dashboards providing site-level air quality and noise status across all active zones
- Predictive Alerts — Alerts triggered before regulatory thresholds were breached, reducing unplanned work stoppages by over 60%
- Automated regulatory — Reporting generated from preprocessed, auditable data, eliminating manual data compilation
- AI-driven Correlation — Correlation between construction activity schedules and environmental impact, enabling proactive shift planning to minimise complaints


.png)
.png)